Crime Rate in the United States
Results
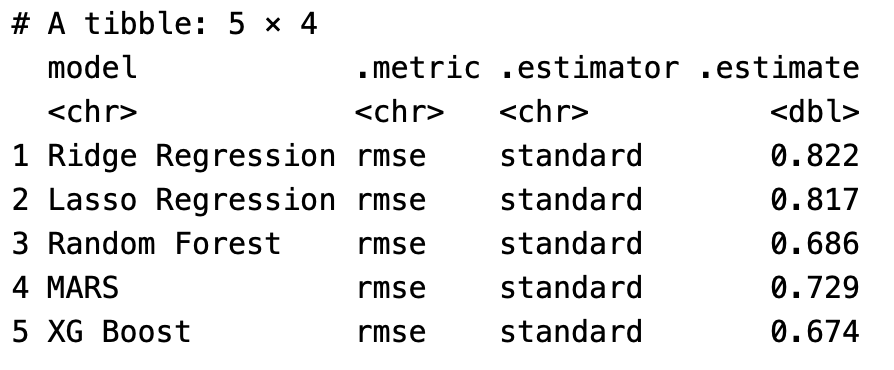 Violent
 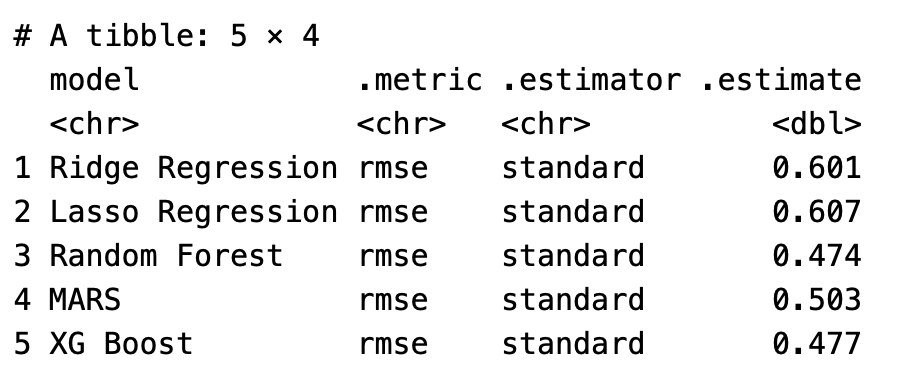 Property
Final prediction for violent crime rate in 2016 with XG Boost has a RMSE of 0.593.
Final prediction for property crime rate in 2016 with Random Forest has a RMSE of 0.459.
Violent Property
Final prediction for violent crime rate in 2016 with XG Boost has a RMSE of 0.593.
Final prediction for property crime rate in 2016 with Random Forest has a RMSE of 0.459.